Global Amazon margin analysis
See where profit is created, lost, or shifted across ASINs, countries, and brands.
Compare all of your Amazon Marketplaces
in one dashboard
Managing Amazon margins across multiple countries is complex.
Differences in sourcing, fulfillment, pricing, and demand allocation often hide where profit is actually generated.
Why Amazon Vendors lose margin without knowing it
Most Amazon vendors already track sales and revenue per country. What they don’t see clearly is:
Understand cross-country sourcing & profit attribution on Amazon
Why Amazon fulfills demand across borders
Amazon often fulfills demand cross-border, sourcing products from another country because internal logistics are extremely cost-efficient.
What the AMVisor Margin Calculator does
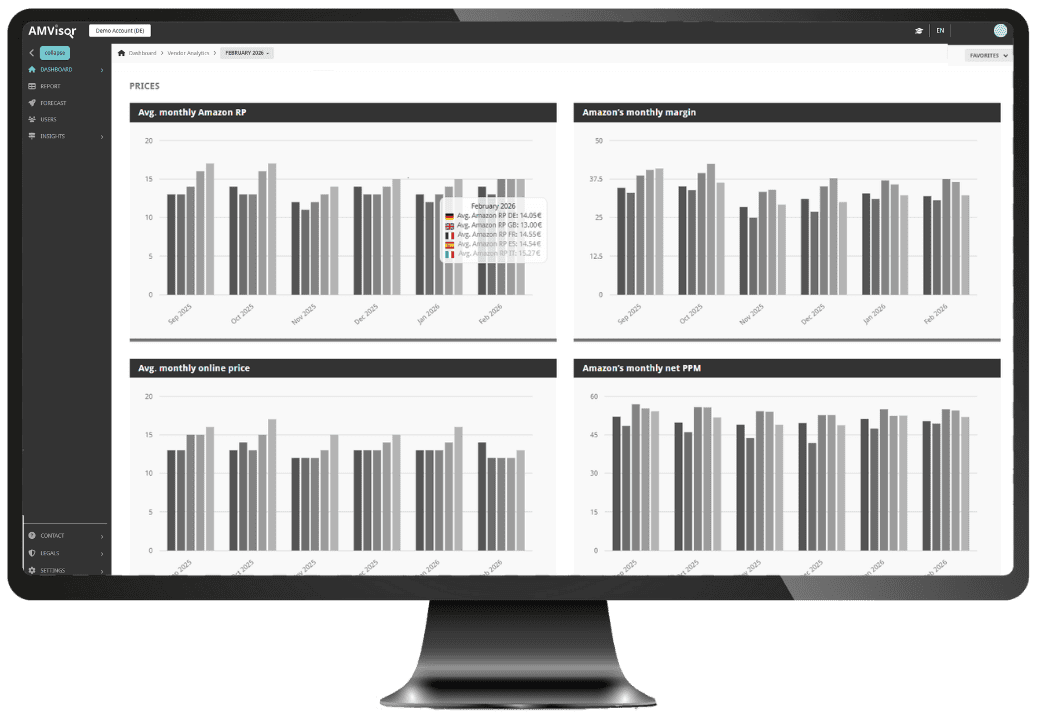
Compare margins globally
The Margin Calculator compares purchase price and selling price across all Amazon marketplaces in one centralized dashboard.
You can instantly:
- Compare margins per country
- Analyze margins per ASIN
- Identify high-revenue but low-profit markets
- Understand where demand is served from—and why
This makes it possible to see which countries truly drive profitability, not just sales volume.
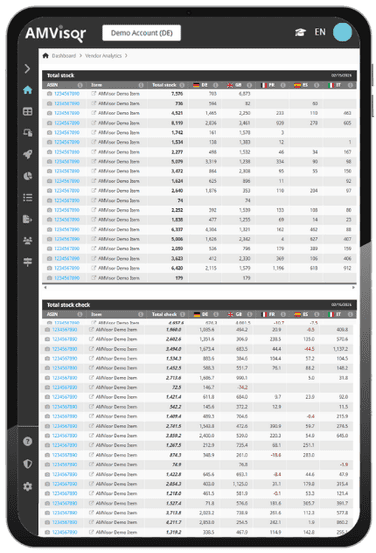
Sourcing vs. demand country
The Margin Calculator, helps you understand:
- Why one country supplies demand for another
- How sourcing country vs. demand country affects profit
- Why some markets generate higher margins despite lower demand
- How revenue and profit are attributed at brand level
This transparency is critical for global negotiations, pricing decisions, and portfolio optimization.
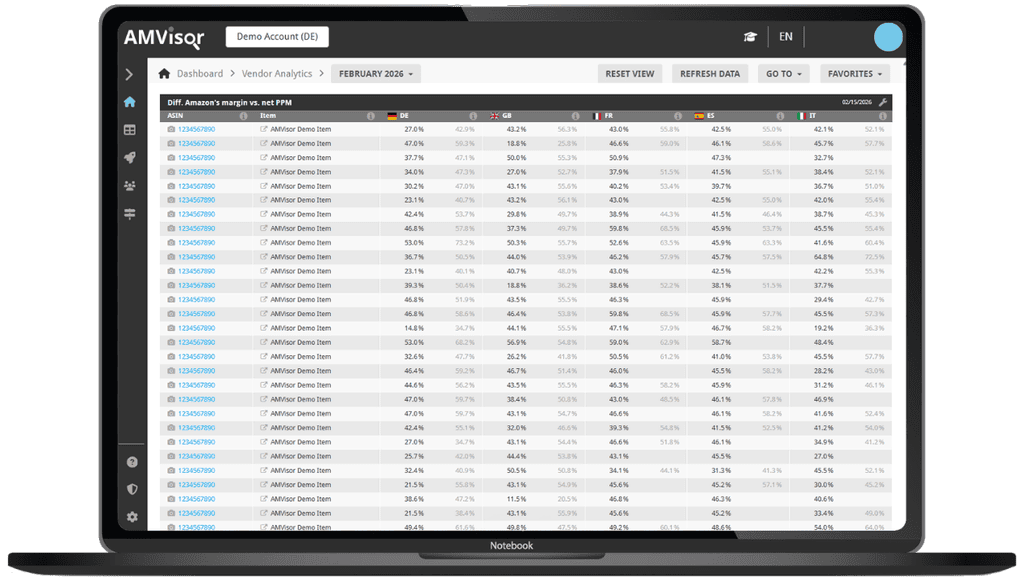
See Net PPM per ASIN
Instead of relying on aggregated margin numbers that often just represent estimated data, AMVisor shows:
- Net PPM per ASIN
- Margin differences by country
- Structural margin gaps between regions
This allows teams to:
- Spot underperforming ASINs early
- Optimize pricing strategies country by country
- Prioritize profitable assortment expansion
- Support fact-based negotiations with Amazon
Core benefits of the Margin Calculator
All KPIs are available centrally, consistently, and comparable across regions.
Built for global teams, brands & enterprises
The Margin Calculator is fully embedded into the AMVisor All Dashboard, allowing:
- Centralized margin visibility for global managers
- Country-level operational views for local teams
- Brand-level or country-level account structures
- Shared, customizable reports for alignment and accountability

This creates one single source of truth for margin discussions across teams, countries, and management levels.
Trusted by leading Amazon 1P vendors
Read for yourself how AMVisor supports its partners in overcoming Amazon profitability issues.
Why Amazon vendors choose AMVisor

